How to create efficient
Power BI Dashboards?

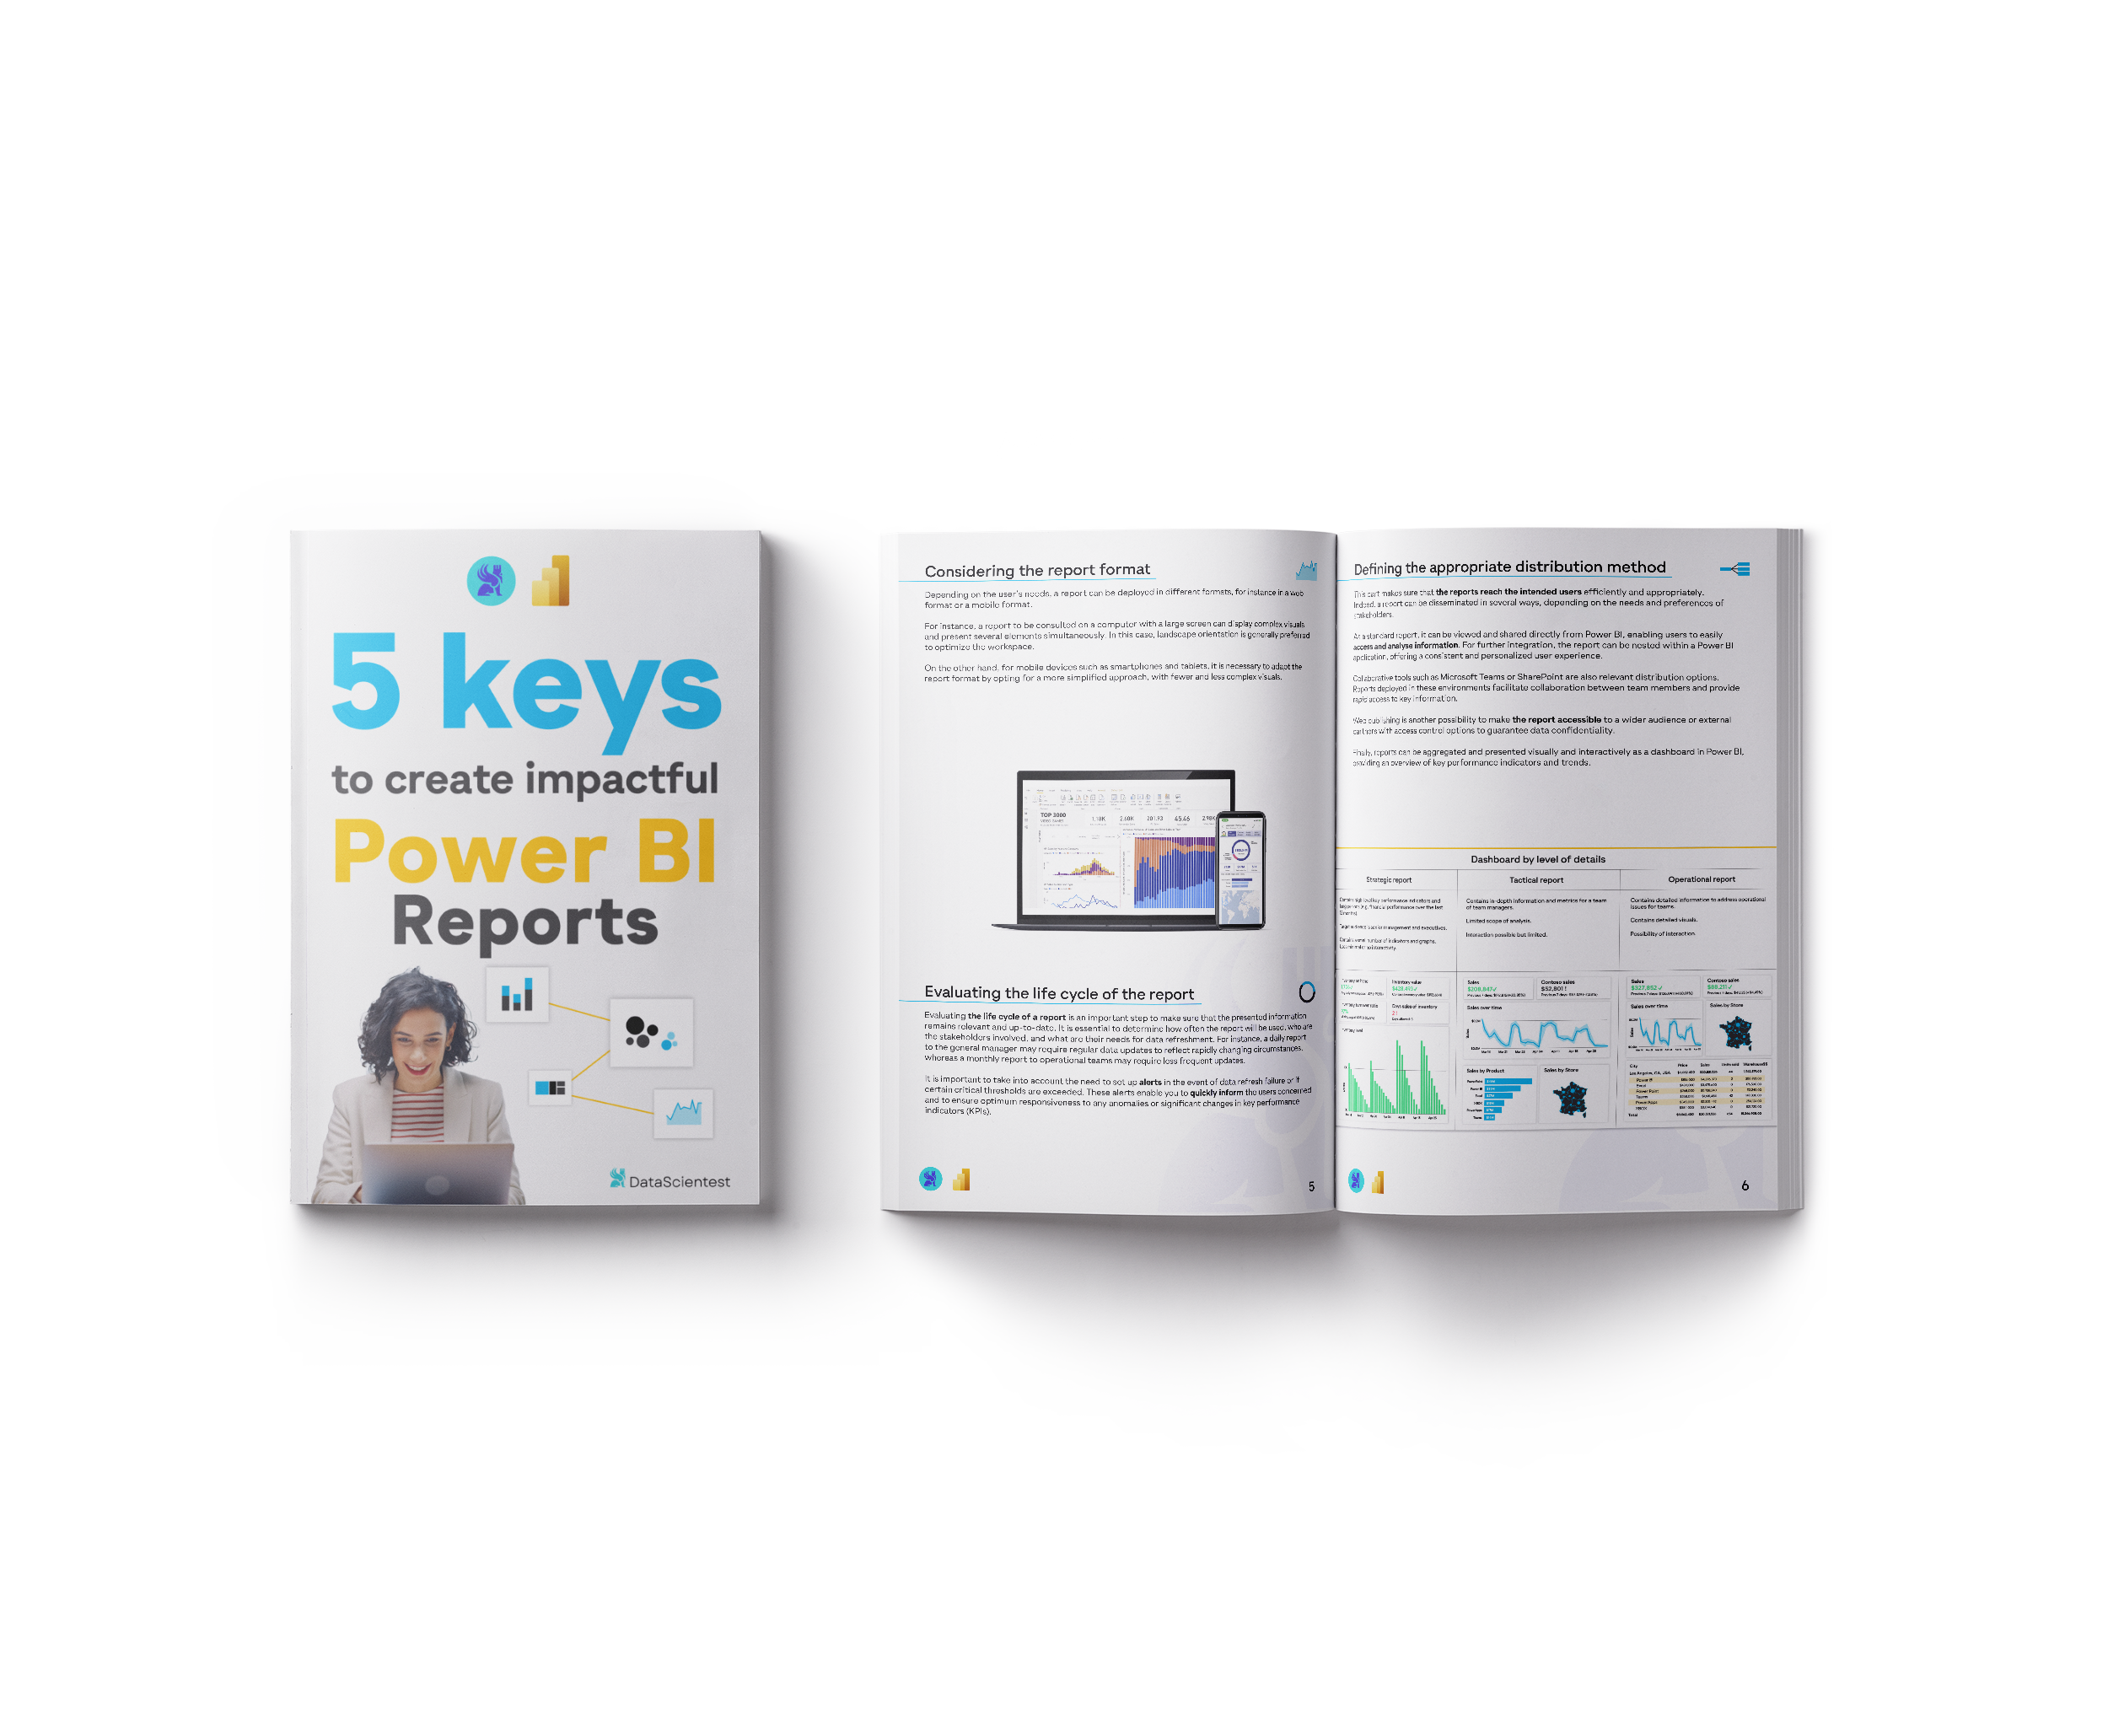
Did you ever ask yourself how to create impactful Power BI dashboards? In that case, our free e-book is just the thing for you! It will teach you key competencies which are necessary to create efficient dashboards that meet the demands of the end-users.
In this e-book we show you how to:
- Identify reporting requirements
- Define a graphic chart and implement it in Power BI
- Choose the appropriate visualization for each analysis
- Leverage Power BI's storytelling features


